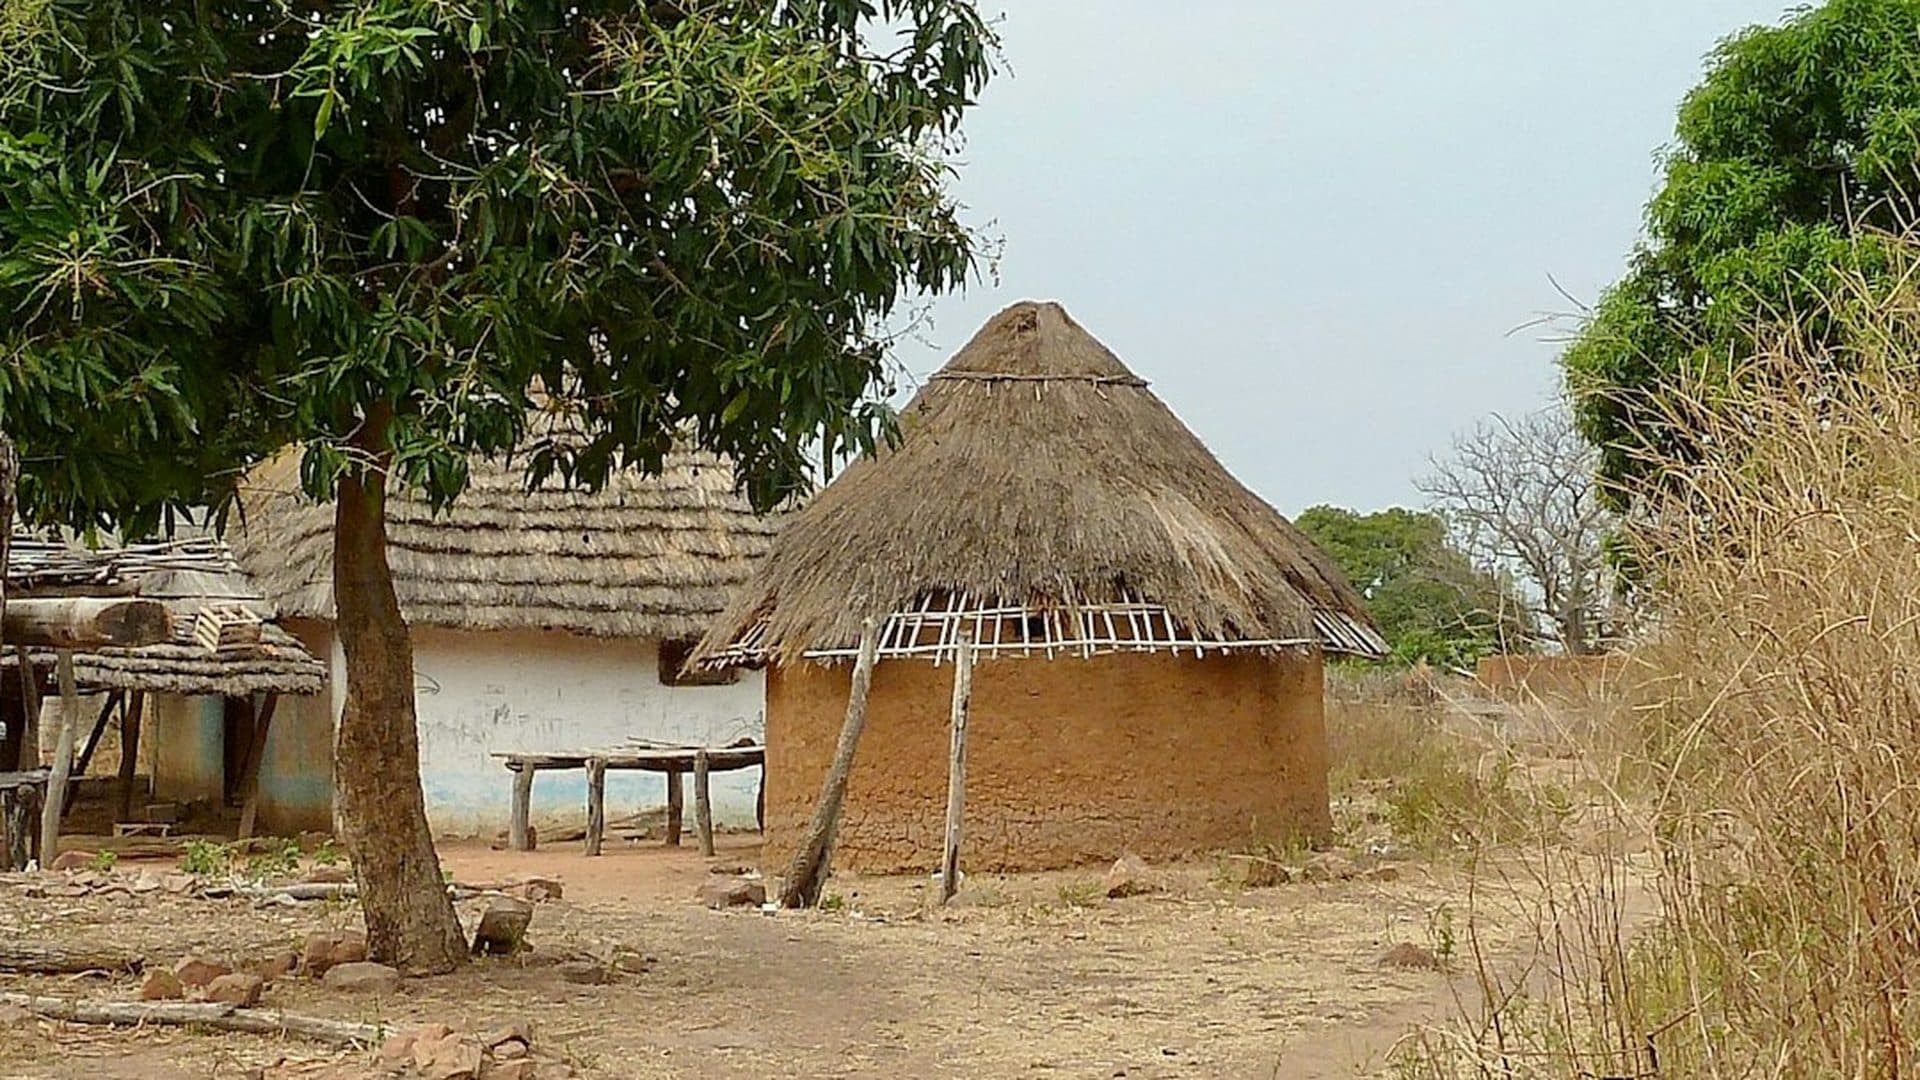
By the Government's own measure, the poorest district in Ghana.
Not one of the poorest. Ranked last of all 2612 districts, on the same thirteen indicators used to score every one of them. This is where Ramah works, and this is the evidence for why.
Every figure below carries its source
The rank, in context
Nabdam is not in the crowd at the bottom. It is past the end of it.
Ghana's Multidimensional Poverty Index scores every district on the same thirteen indicators across four dimensions, employment included, which the global MPI leaves out. Against that one yardstick, 24.3%2 of Ghanaians are multidimensionally poor. In Nabdam it is 68.6%1, which is also the highest of the fifteen1 districts in the Upper East Region.
~11×
Nabdam's poverty rate against Ghana's least-poor district2
Each mark is one district, ordered least to most poor. Only the three labelled values are sourced figures: the least-poor district, the national rate, and Nabdam. The intervening marks show the shape of the distribution, not 258 individual measurements.
Understanding the context
Why Nabdam?
Nabdam sits at the northern edge of Ghana's Upper East Region, where rain arrives for roughly three months each year. The lean season, stretching from March through July, is not merely a gap in harvests; it is the period when households draw down savings, children's diets narrow, and health-seeking behaviour stalls as transport costs rise relative to available cash. Most families have no alternative income stream to bridge it.
Women, and widows in particular, face a specific structural disadvantage rooted in customary land and shea-tree tenure. This is not a failure of individual effort; it is a gap that community structures, faith institutions, and well-designed programmes can collectively address.
Youth out-migration compounds the challenge. Young people leave not because they are indifferent to home but because the local economy does not yet offer a credible pathway to dignified livelihoods. Vocational training infrastructure is absent, and the single public senior high school serves a district of 51,8614 people. Ramah's graduation pathway is designed with this reality in mind: build the pathway locally so that migration becomes a choice, not a necessity.
The statistical picture confirms what residents already know. Ghana's national MPI analysis identifies employment as the dominant driver of poverty here, alone accounting for 41.9%1 of the district's poverty incidence score, followed by lack of health insurance coverage and school lag. The full weave is set out below.
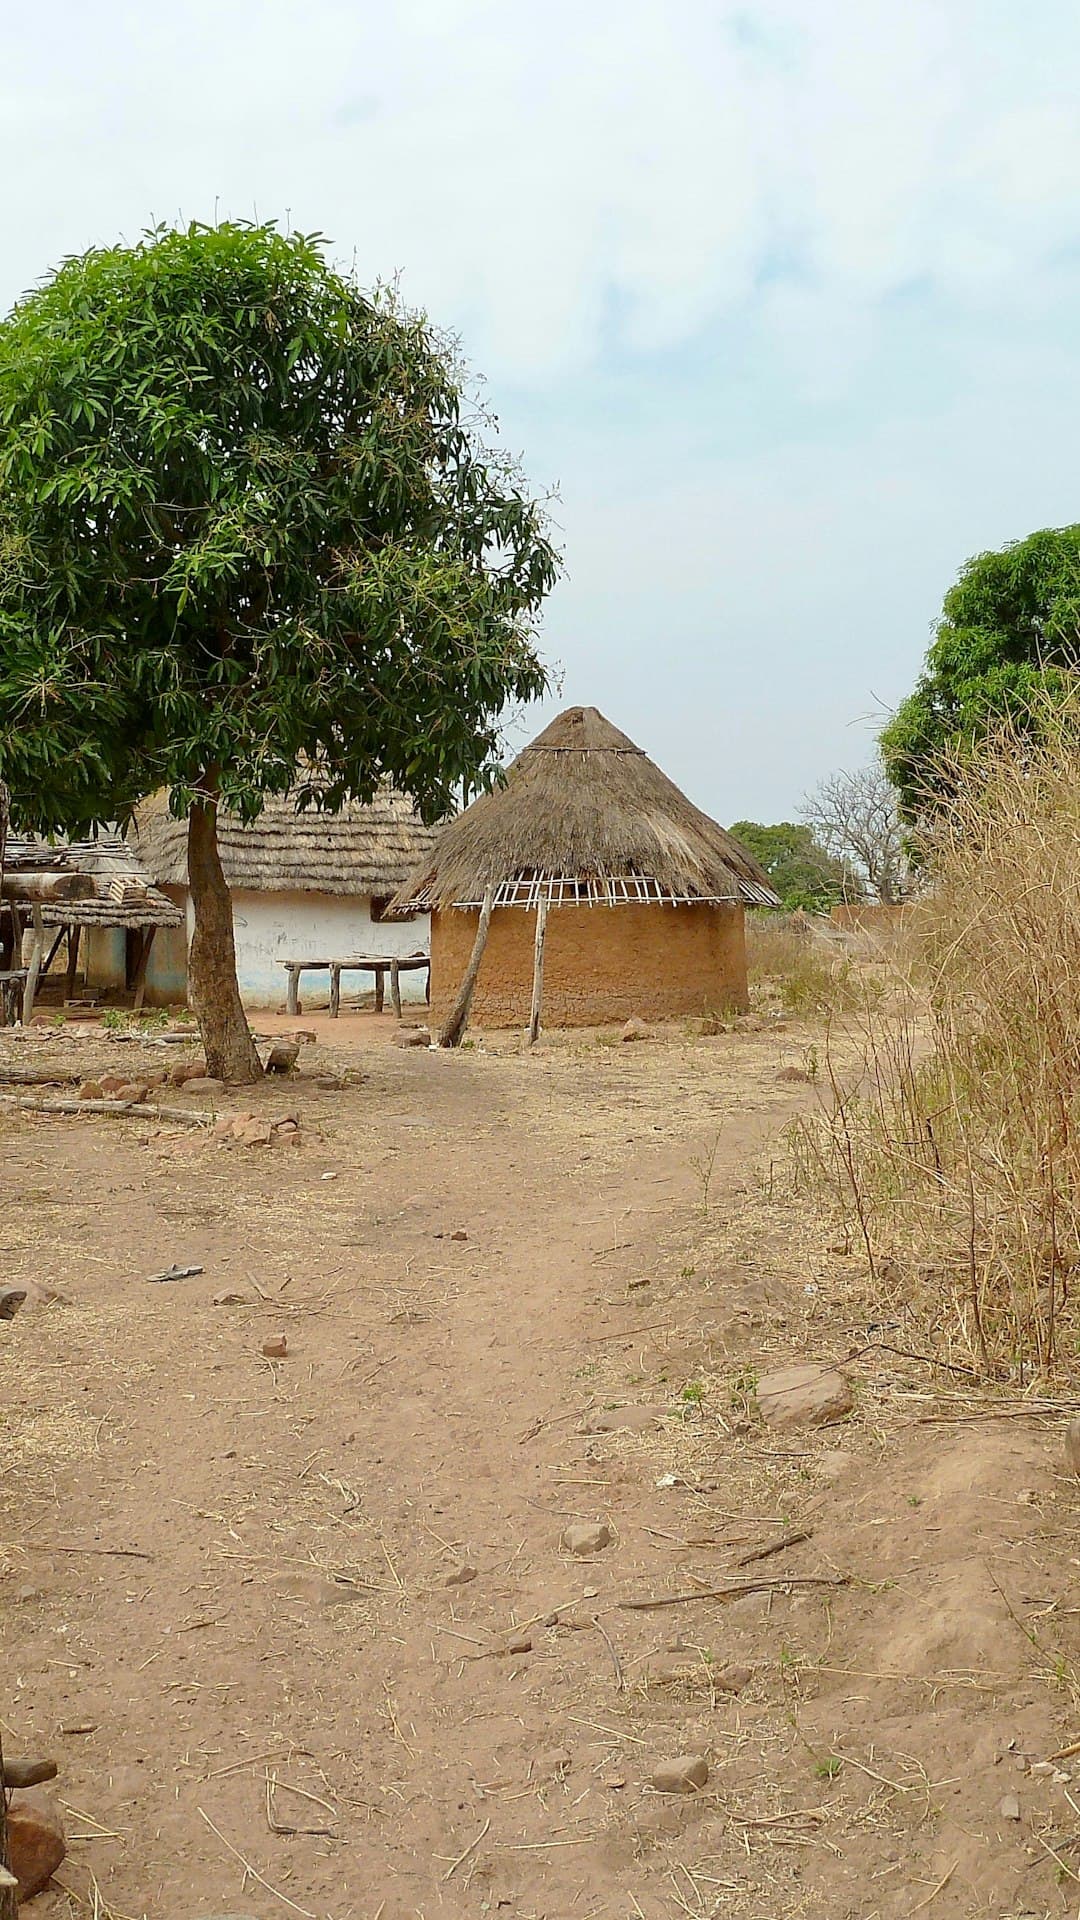
The agricultural year
12 months5
March to July, the lean season. Wells have run dry and the harvest has not yet come in. Households sell assets, cut meals, and defer treatment.
Roughly three months of rain, from July. Almost all local employment depends on it, and it is the only window in which the district's dominant livelihood earns anything.
July falls in both. The rains beginning and food arriving are not the same event, which makes it the hardest month of the year rather than the turning point it looks like on a calendar.
What the poverty is made of
One number, thirteen strands. Pull on employment and most of it moves.
The MPI is not a single measurement but an index woven from thirteen indicators. Nabdam's 68.6%1 is the cloth; these are the strands it is made from, each drawn to its true share. Employment carries 41.9%1 of it on its own, which is why a programme here has to reach income and not only services.
Employment, health insurance and school lag together account for 64.5% of the district's poverty incidence score. The remaining strands are shown as one band because none of them dominates.1
Nabdam sits in the straw-weaving belt around Bolgatanga, and weaving is one of the trades in Ramah's vocational strand. The three named drivers account for 64.5% of the district's poverty incidence score between them.
Why widows, specifically
The burden is not shared evenly
In Nabdam, female-headed households are poorer than male-headed ones, 71.0%1 against 67.8%1. The gap is not large on paper, but it sits on top of a structural disadvantage the statistics only begin to show.
Customary tenure governs who may use farmland and who owns the income from shea trees, and both norms favour households with a male head. A widow can lose access to land and shea at the very moment she is absorbing the economic shock of bereavement, while still carrying sole responsibility for her children's food, schooling, and health. That is the gap Ramah's graduation pathway is built to close, not with one-off relief, but with assets, savings, and a route to dignified income she controls.
Poverty rate by household head
+3.2 points
71.0%
Female-headed
67.8%
Male-headed
The axis runs 60% to 80%, not 0 to 100, so a 3.2-point difference is visible at all. Both figures come from the same district MPI release. Disaggregated by sex of household head.1
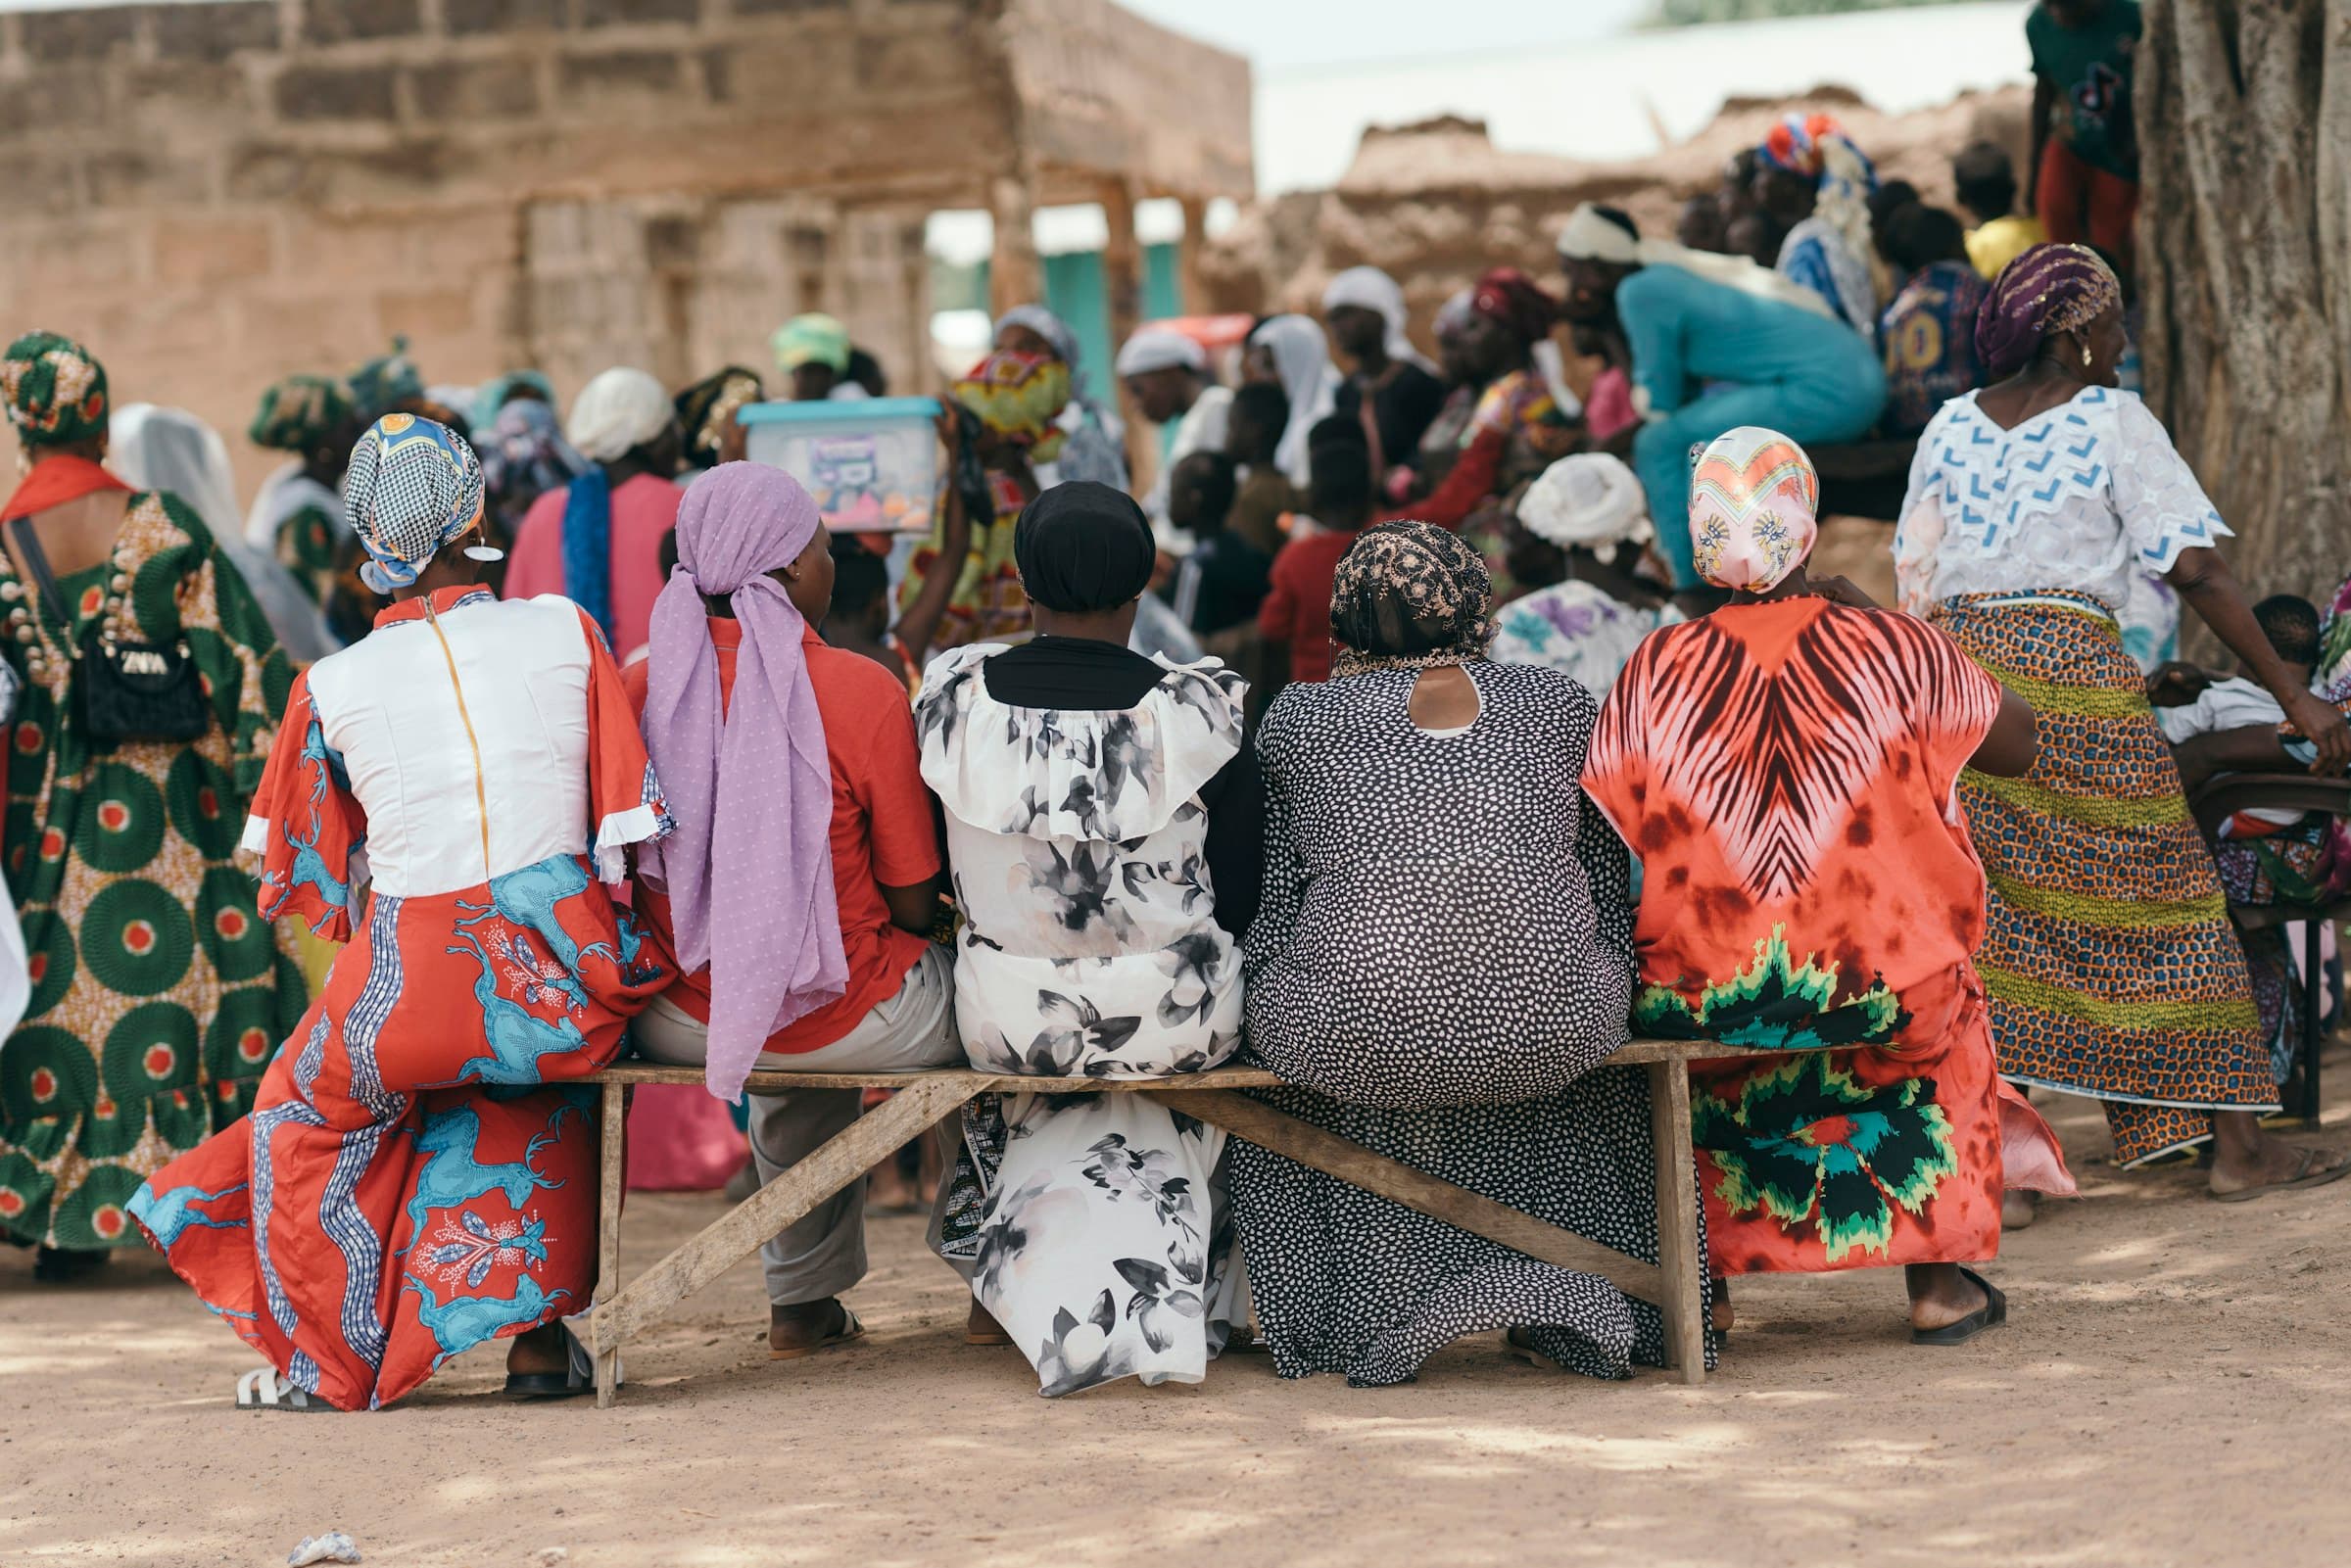
Where Ramah works
Four deprivations, one household
These do not queue up politely. A missed clinic visit becomes a missed week of school, and a lean season becomes a sold-off goat. Each figure below comes from official district or national data.
Health
326
Health facilities, 2026
28 CHPS compounds, 2 health centres, 1 CHAG facility and 1 private hospital. Free Primary Health Care launched in June 2026, though distance remains a barrier.
42.3%5
Of outpatient cases are malaria
Community health volunteers and a growing CHPS-compound network carry primary care for 51,861 people4. Malaria alone accounts for more than four in ten5 outpatient visits.
Education
45.9%1
Literacy rate, population aged 6 and over
Higher among males (47.6%) than females (44.2%). The complement, 54.1%, cannot read and write.
One public senior high school serves the entire district. No technical or vocational school exists locally, closing off skills pathways for young people who do not qualify, or cannot afford, academic routes.
Livelihoods
Rain-fed smallholder farming is almost the only employment base. A lean season that stretches nearly half the year without supplemental income leaves households with no buffer against illness, school fees, or crop failure.
Water and sanitation
Water access has improved, but sanitation coverage remains critically low. Open defecation and inadequate handwashing facilities sustain disease transmission that undercuts health and school-attendance gains elsewhere.
Inside the district
Where the need is deepest
Poverty is not uniform across Nabdam. The gap between its poorest and least-poor community is wider than the gap between Nabdam and Ghana as a whole.
Every major community, ranked
20 localities · 32.6% to 94.4%
- Logre-Daborepoorestpilot94.4%
- Sakoti Nyogbare Ndaanboug92.7%
- Zoulenwni Zoa90.5%
- Nakpaliga-Selug90.4%
- Sakoti Nyogbare Nafong89%
- Sakoti Kugre87.8%
- Zanlerigu-Gundong80%
- Nangodi-Nyabok78.3%
- Damolgo-Tindongo-Gaane78.1%
- Nangodi-Soliga78%
- Damolgo-Tindongo-Kundure75.6%
- Kongo Dasabligo71.1%
- Pelungu66.2%
- Damolug-Zoog63.7%
- Nagodi-Kalini58.9%
- Yakoti Yapaala58.1%
- Nangodi-Nakpaliga52.8%
- Kongo41%
- Zanlerigu Gaane39%
- Zanlerigu Gane Asonge32.6%
poorest, the highest deprivation rate recorded in the district. pilot, the December 2026 programme site. Logre-Dabore is both, which is the reason it was chosen. Locality multidimensional-poverty rates, Ghana Statistical Service, 2021 PHC.3
From evidence to action
Where Ramah begins, and why it costs more to begin there
The December 2026 pilot begins in Logre, where multidimensional poverty reaches 94.4%1, the highest of any locality recorded in Nabdam.
Starting at the deepest need rather than the district seat costs the programme convenience. Logre sits further from the tarred road, and community entry there takes more visits, not fewer. That trade was made deliberately: a model proved where conditions are hardest is a model worth scaling. The 2027 scale-up extends to the neighbouring communities holding the highest concentration of Nabdam's poorest households.
Ramah's approach is rooted in the graduation pathway model: a sequenced intervention of productive asset transfer, consumption support, livelihoods coaching, savings mobilisation, and social inclusion. It is not untested theory. A randomised controlled trial in Ghana's Upper East and Northern regions, published in Science, found the model produced lasting gains in consumption, assets, and food security7 that persisted a year after support ended. Ramah is adapting an approach with proven results in this very region.
Pilot site
December 2026
94.4%
Logre, multidimensionally poor
The existing ecosystem
We work alongside, not around
Nabdam is not an empty field. The district's own budget names the national and international actors already working here. Ramah complements that ecosystem, bundling health, education, savings and livelihoods into a single graduation pathway and filling the gaps others do not cover, rather than duplicating what is already in place.
UNICEF5
Health, education, child welfare and sanitation
UNFPA5
Public health
World Bank, GPSNP / SOCO5
Public works and grants for the extreme poor; community infrastructure
IFAD5
Business Advisory Centre and rural enterprise
CIDA (Canada)5
Agriculture and extension support
LEAP5
Government cash transfers to the extreme poor, around 70 communities
PWD Fund5
Income generation for persons with disabilities, around 150 a year
Ghana School Feeding Programme5
School meals across target schools
Presbyterian Agricultural Services7
Delivered the graduation-model trial in this region
Sources and methodology
Every figure on this page is checkable
All of it is drawn from official government data or peer-reviewed research. Poverty is measured by Ghana's Multidimensional Poverty Index: thirteen indicators across four dimensions which, unlike the global MPI, include employment. National and district figures here use the same 2021 census MPI, so they are directly comparable.
- Multidimensional Poverty Report: Nabdam District
- Multidimensional Poverty Index Scorecard (national, all 261 districts)
- Multidimensional Poverty Metrics by Locality, District and Region (StatsBank)
- 2021 Population and Housing Census
- Nabdam District Assembly Composite Budget 2024
- Free Primary Health Care launched in Nabdam
- A multifaceted program causes lasting progress for the very poor (Ghana arm, Upper East / Northern regions)
- Nabdam District Assembly Composite Budget 2026 (2026-2029 MTEF)
- Nabdam District data page (LinkDataDistrict/3555)
Figures last reviewed against their sources on 26 June 2026. Where a district figure has been superseded, for example health-staffing levels, both the dated original and the update are shown. Locality area-council assignments are held internally but not published here, because they are not yet confirmed against an official District Assembly source.